One of the most difficult parts of construction is understanding the subsurface ground conditions.
How much soil is there?
What is the classification?
How long do we need to treat the soil once it's out of the ground?
Where can the soil go once it's been removed?
Why am I on this wall?
Where's Buttercup?
In the past, we've done some neat work with soil logistics once it's been removed, but what about planning while it's in the ground? Sure, we have soil pre-characterization reports, but they tend to look like a civil engineer and Charles Dickens teamed up to write War and Peace II.
In a perfect world, we'd get a 3 dimensional model from the civil engineer in charge of the soil report. Since we're a few years (or decades) away from that, the next best info we have is the excel chart of soils at depths.
With some creativity (and a little brain damage), we can make something visually intelligent out of a mess of a spreadsheet.

Step 1: Determine what data is available to you. Ideally, you'd get the actual soil core drill data. With that info, you know the top and bottom dimension to each strata layer from a surface dimension.
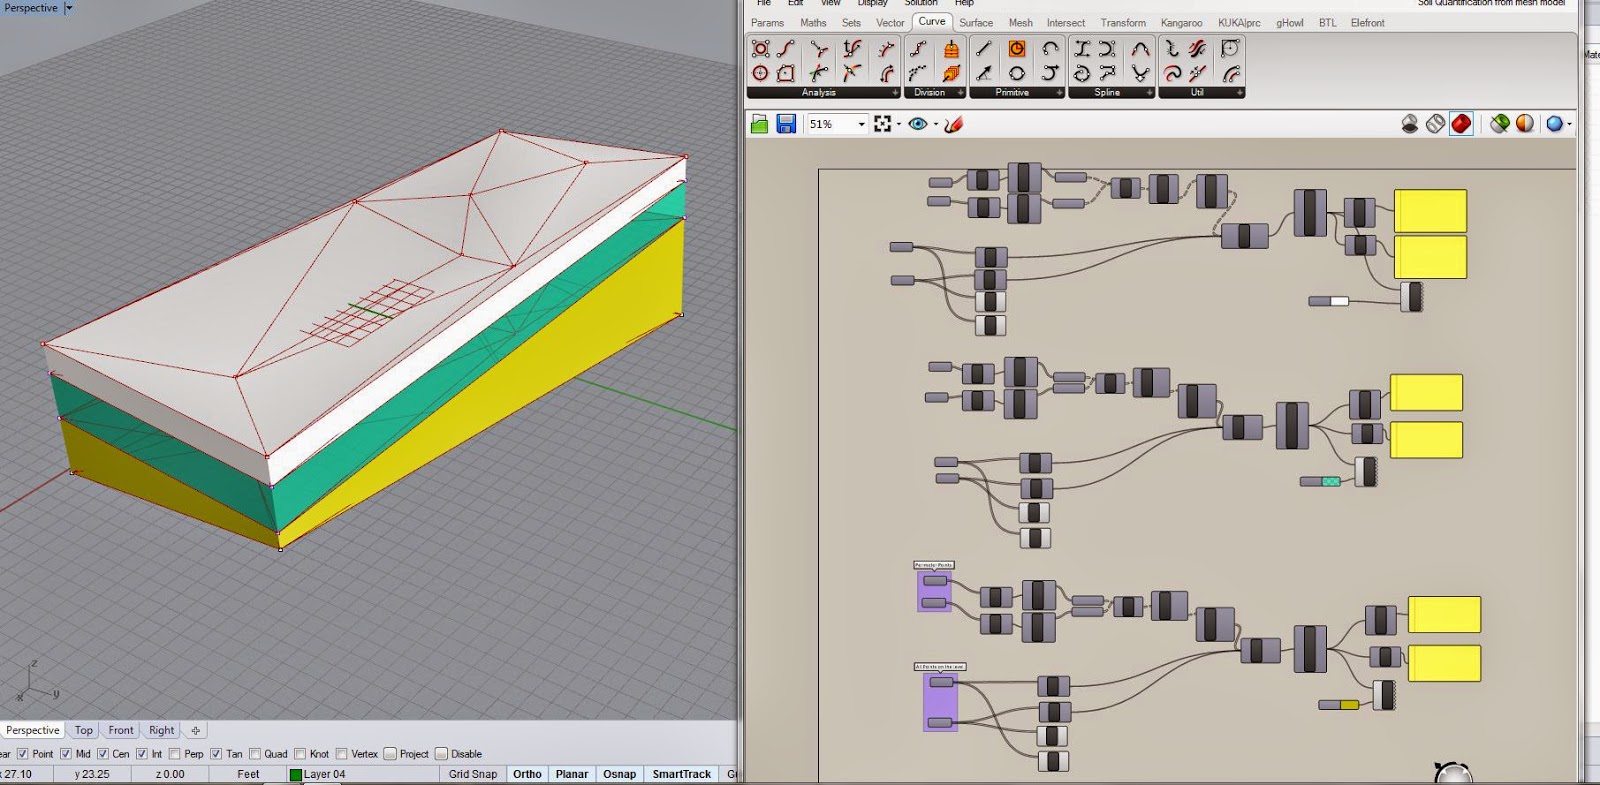
Step 2: Re-build the core, digitally. We do this because we're going to have a mesh, and meshes are informed by points. Cores are roughly circular, have a center point that is easy to locate on global x,y,z, and are easy for rhino/grasshopper to play with.


Step 3: Use some grasshopper magic to create the meshes of each strata. Yes, there is some error in the final mesh, but it is as accurate as the cores are. That is, the more core samples you take, the more accurate the 3D model will be.
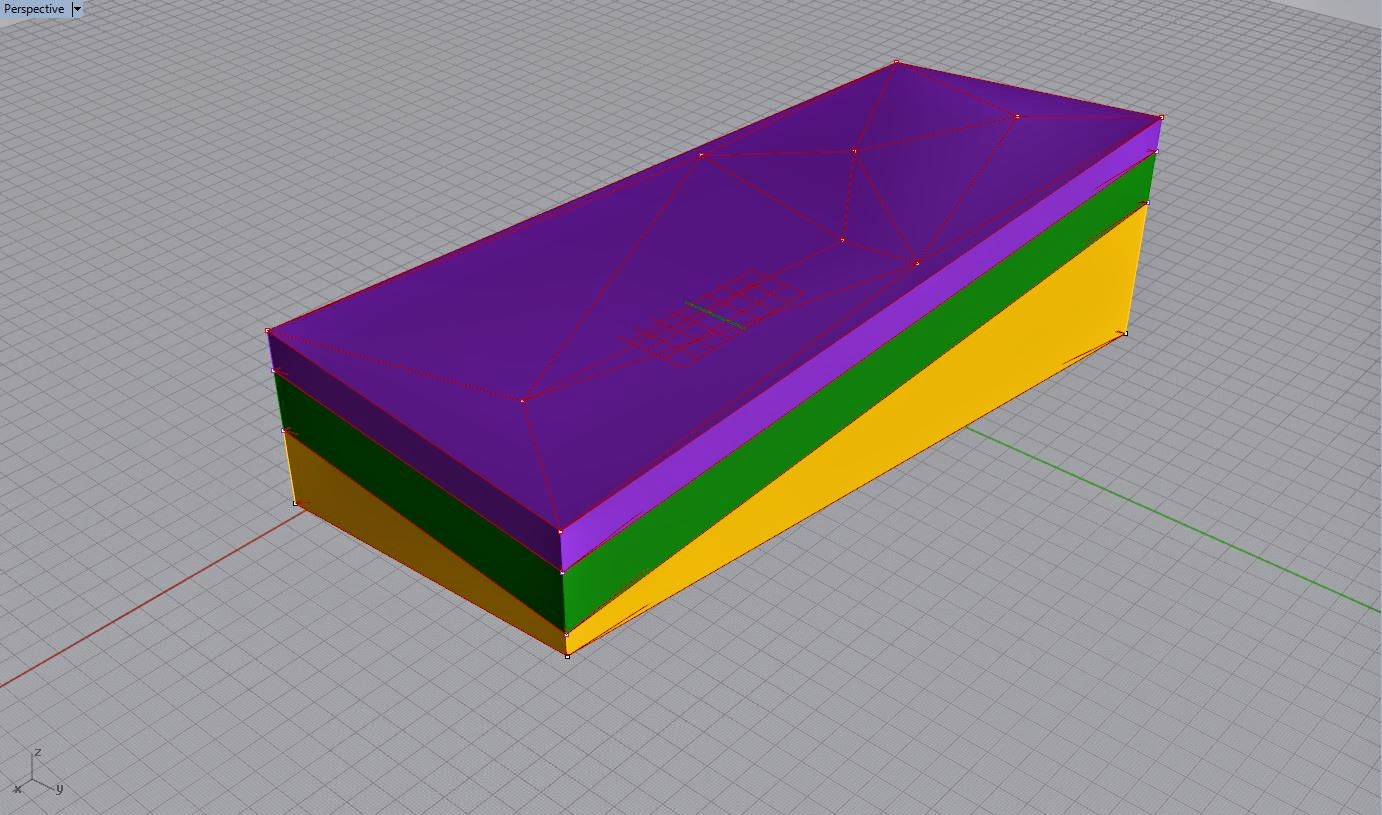
Step 4: Section cut for clarity.

Step 5: Export in STL format for 3D printing.
Voila!
No comments:
Post a Comment