Clash Based Clustering Analysis - From the GBCO_VDC Top Secret Files
Clashing models has become SOP for the construction industry, and tools like Navisworks make our lives significantly easier when it comes to visualizing models in space. The inherent problem with clash detection (and most other ****desk software tools is that they are built for the larger audience of the AEC, sacrificing targeted functionality for a good UI and ease of use.
Today, we'll show you how we took some of the raw information from Navisworks (where it sits, but is unusable), and turned it into something usable in Rhino and Grasshopper. We then can push back the visual data into Revit or CAD, so that designers/fabricators can use the information in their native documentation software.
The first month I had been hired by Gilbane, John Tocci Jr. tasked me to figure out a visual way to represent, organize, and sort clashes in a better way than Navis provided us with the vanilla Roamer. He and David Joslin had seen a cool LISP routine at another conference that did something similar in CAD, but it was bulky and tough to use for someone with little-to-no scripting experience.
David and I pondered for a week or so and came to the conclusion that we knew there was an exportable x,y,z coordinate for every clash in a model.
That weekend, in a fit of rage (KU basketball had just lost to Missouri in one of the worst officiated games in B12 history), I worked up the basis of the grasshopper script that would read the input excel document and convert it into tangible geometry.
In nearly every drafting software, all elements either have a base-point (CAD) or their own center coordinate in x-y-z-coordinate space. Additionally, when you clash two models or elements in Navisworks, Navis creates a new x,y,z coordinate. We're pretty sure Navis takes the total intersection area and returns the centroid of the region. This location data is actually contained within Navisworks. This is the central crux to the workflow.
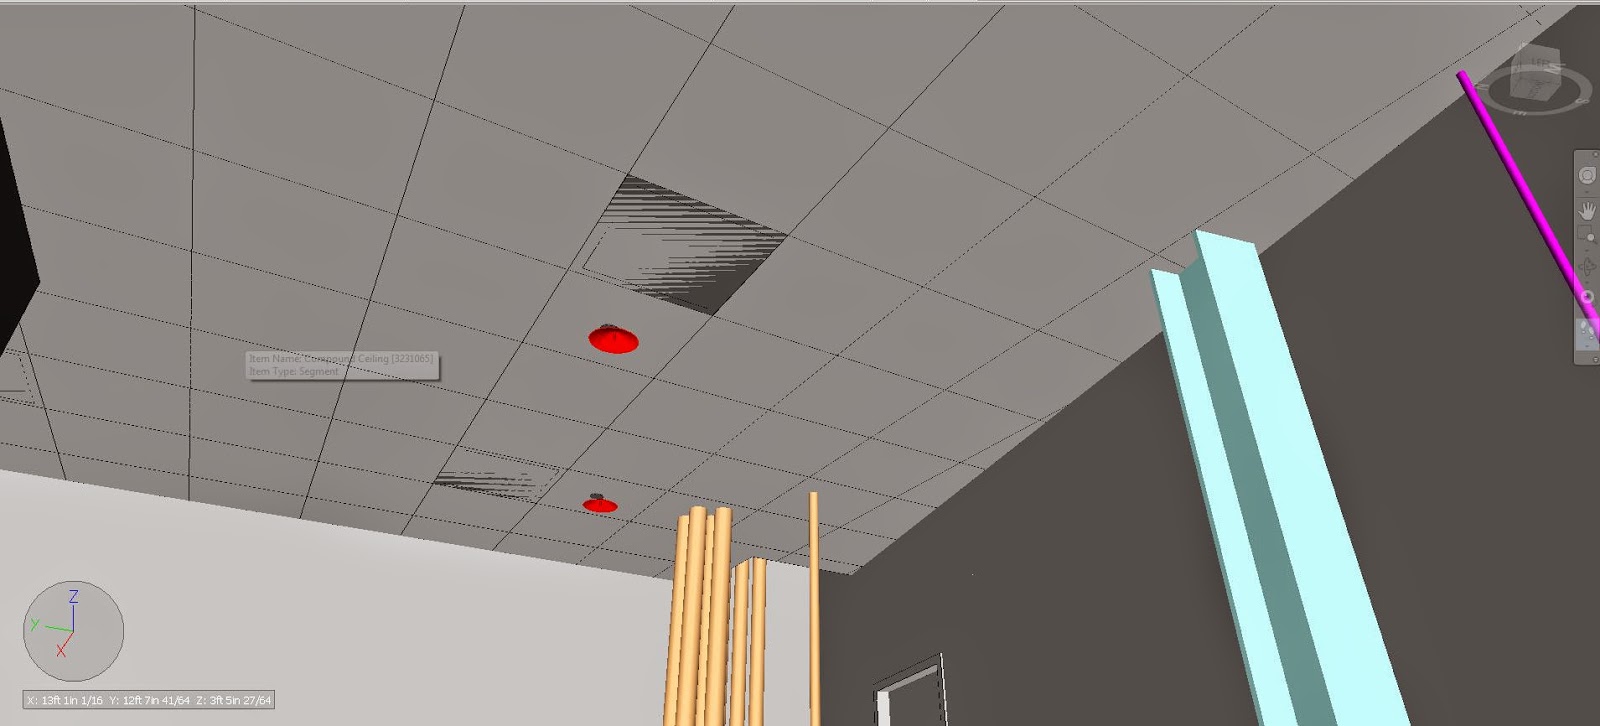
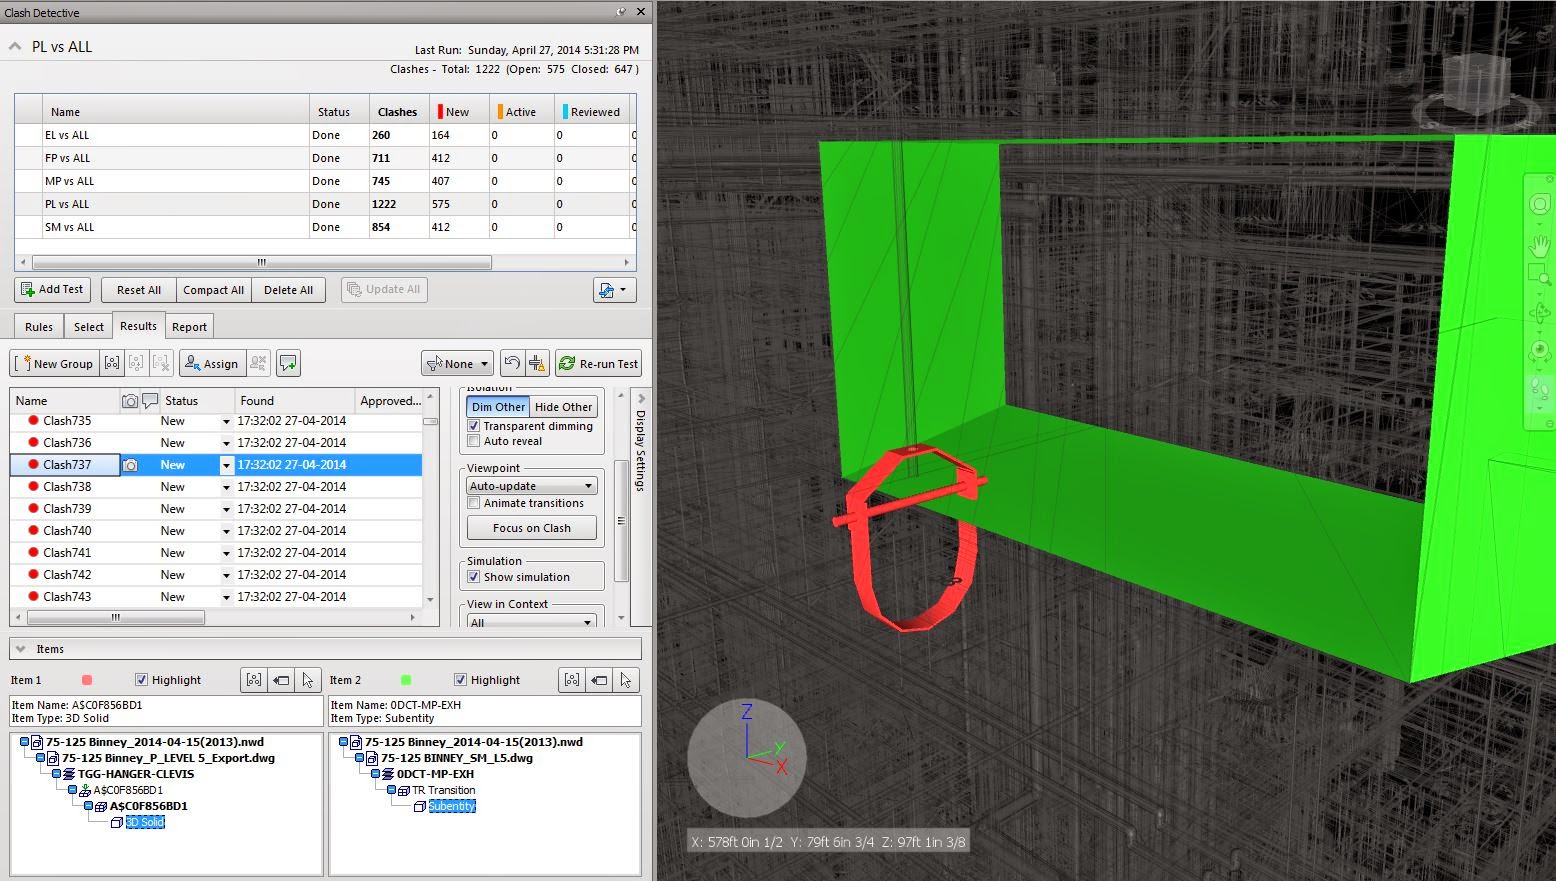
Standard Clash - We see these every day in the industry: We need to get location data from Navis to XML to Grasshopper.
XMLs in file
Proximity Script
Issues vs. Clashes:
The visual representation of the clashes is only part of the equation. We needed a way to classify 'big' issues vs 'small' issues. For instance, the clash in the first image is nothing in the scheme of a building. However, 25 clashes in a 3' radius in a main MEP hallway is a big freaking deal. That combination of clashes is classified by Gilbane as an 'issue.' At Gilbane we don't track clashes, we track issues. Our proximity script allows us to do that.

Raw grasshopper geometry to be exported to Navis/Revit
For the past 2 years, we have used some form of the script on over 10 different jobs, nationally and internationally. As Jonathan Ammon showed in the below image at BIMForum, owners particularly like the ability to show their architects and engineers that design 'clash-free' does not equal 'free of conflicts.' Because of the work that Jonathan put into that process, Gilbane saved the entire design team a significant amount of heart-break and money when it came time to integrate some of the tenant systems into our core-shell job.