Sunday, October 5, 2014

Gilbane VDC's Minority Report Glove has arrived (And it plays nicely with the Rift!)

The Myo Dev Kit is Here


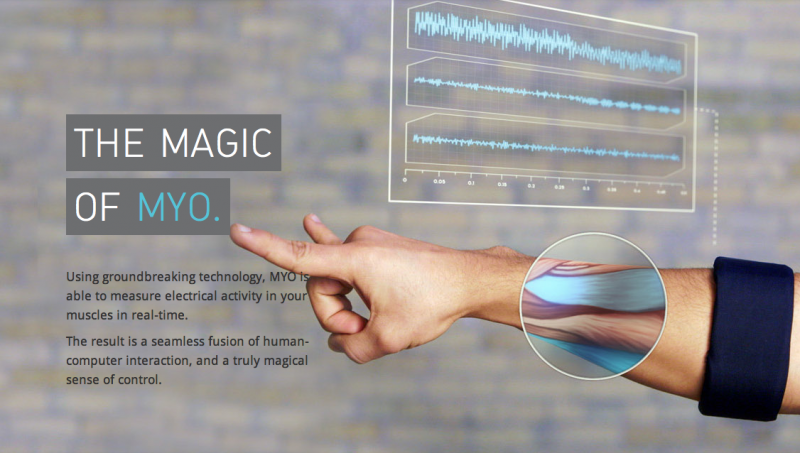
So this is the Thalmic Myo.  It arrived yesterday.


It uses the muscles in your arm and key binds it via Blue Tooth to most open source devices.


As part of the Dev Kit, Thalmic has given us integration with:

VLC
iTunes
PowerPoint


and, most importantly, Unity!


For those of you who don't know, here at Gilbane VDC, we're using Unity and the Rift for AEC visualization.  

What the Myo means for us, is the ability to continue to push the virtual interaction with our buildings in a way that no one has ever been able to do in the past.  In addition to using the Rift for the visuals, we will soon be able to pick up and interface with objects in the scene we're showing architects and owners.


So enjoy our demo of holding a cup of coffee while wearing the armband!   


Monday, September 29, 2014

Why we use Grasshopper and Rhino


I was recently asked:

"Why do you guys rely on Rhino and Grasshopper so much?  Aren't Revit and Navisworks enough?" 

It's a good question, after all, Revit and Navisworks are stupid-expensive platforms.  Shouldn't they be able to do everything that we need?

Well, the answer to that is complicated, because Grasshopper is seen primarily as design tool in the same vein as SketchUp: It doesn't carry industry standard sizes or ISO standard geometry in the way that we can lean on Revit for.

But when it comes to point data, that is, center-points, centroids, and most importantly, multiple lines through 2 points in non-linear planes, Grasshopper and Rhino are your best friends.

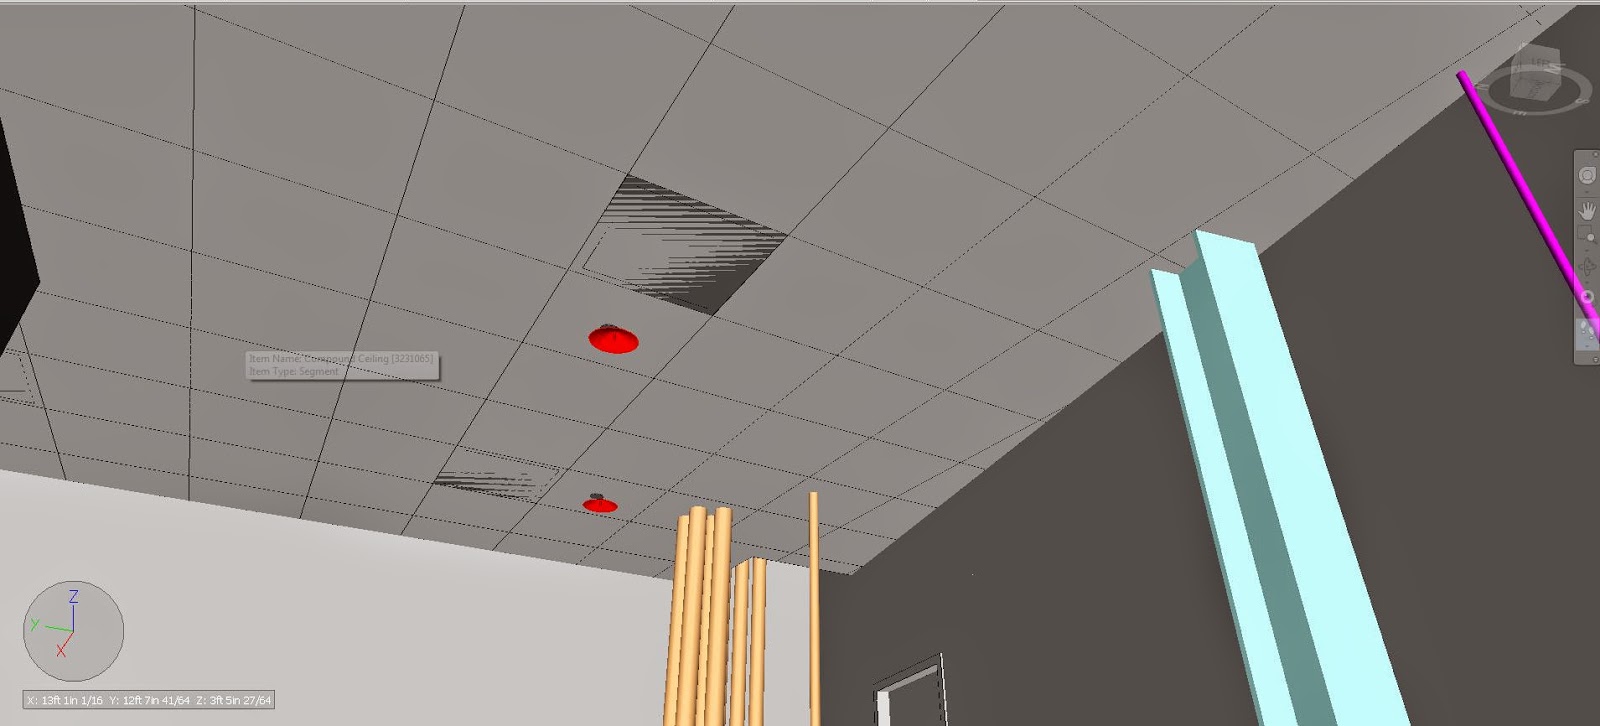
A great example of this is getting ceiling crid lines from 2D Drafting Views in Revit to show up as useful linework within Navisworks.


There is a workflow within AutoCAD that would require lots of movement with Ortho turned on, but let's face it, no one likes working in 3D CAD.  It requires you to draw in Orthographic viewpoint, and you start to feel like M.C. Esher after about 15 minutes.  


Don't you love getting shop drawings in flat-ortho?


Our fix is to write a custom projection script within Grasshopper that lets us assign 2D grid lines to the entire piece of 3D geometry for the ceiling, not just the bottom.  In CAD, this requires a ton of duplicitive clicking.  Oh yeah, and we can do an entire building with one run of the script.


We'd rather finish in 15 minutes than 2 hours.


Contributions from Ben Peek, John Myers


Wednesday, April 30, 2014

Clash Based Clustering Analysis - From the GBCO_VDC Top Secret Files

Clashing models has become SOP for the construction industry, and tools like Navisworks make our lives significantly easier when it comes to visualizing models in space.  The inherent problem with clash detection (and most other ****desk software tools is that they are built for the larger audience of the AEC, sacrificing targeted functionality for a good UI and ease of use.

Today, we'll show you how we took some of the raw information from Navisworks (where it sits, but is unusable), and turned it into something usable in Rhino and Grasshopper.  We then can push back the visual data into Revit or CAD, so that designers/fabricators can use the information in their native documentation software.


The first month I had been hired by Gilbane, John Tocci Jr. tasked me to figure out a visual way to represent, organize, and sort clashes in a better way than Navis provided us with the vanilla Roamer.  He and David Joslin had seen a cool LISP routine at another conference that did something similar in CAD, but it was bulky and tough to use for someone with little-to-no scripting experience.


David and I pondered for a week or so and came to the conclusion that we knew there was an exportable x,y,z coordinate for every clash in a model.


That weekend, in a fit of rage (KU basketball had just lost to Missouri in one of the worst officiated games in B12 history), I worked up the basis of the grasshopper script that would read the input excel document and convert it into tangible geometry. 


In nearly every drafting software, all elements either have a base-point (CAD) or their own center coordinate in x-y-z-coordinate space.  Additionally, when you clash two models or elements in Navisworks, Navis creates a new x,y,z coordinate.  We're pretty sure Navis takes the total intersection area and returns the centroid of the region.  This location data is actually contained within Navisworks.  This is the central crux to the workflow. 


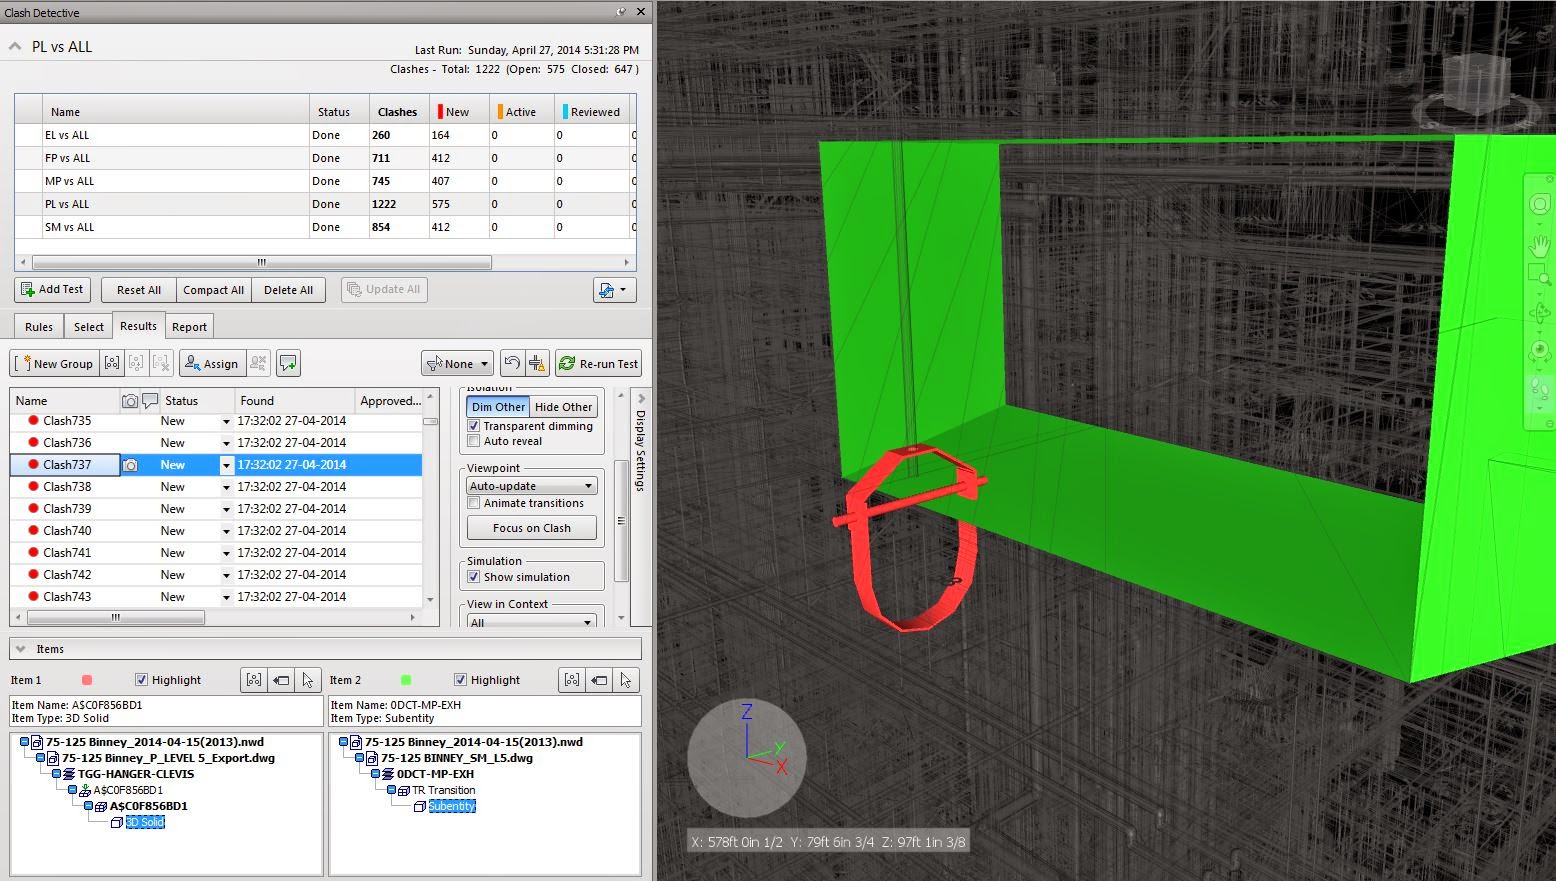
Standard Clash - We see these every day in the industry:  We need to get location data from Navis to XML to Grasshopper.


XMLs in file


Proximity Script


Issues vs. Clashes:
The visual representation of the clashes is only part of the equation.  We needed a way to classify 'big' issues vs 'small' issues.  For instance, the clash in the first image is nothing in the scheme of a building.  However, 25 clashes in a 3' radius in a main MEP hallway is a big freaking deal.  That combination of clashes is classified by Gilbane as an 'issue.'  At Gilbane we don't track clashes, we track issues. Our proximity script allows us to do that.  


Raw grasshopper geometry to be exported to Navis/Revit


For the past 2 years, we have used some form of the script on over 10 different jobs, nationally and internationally.  As Jonathan Ammon showed in the below image at BIMForum, owners particularly like the ability to show their architects and engineers that design 'clash-free' does not equal 'free of conflicts.' Because of the work that Jonathan put into that process, Gilbane saved the entire design team a significant amount of heart-break and money when it came time to integrate some of the tenant systems into our core-shell job.


Wednesday, April 9, 2014

Soil Stratification Visual Analysis

One of the most difficult parts of construction is understanding the subsurface ground conditions.

How much soil is there?
What is the classification?
How long do we need to treat the soil once it's out of the ground?
Where can the soil go once it's been removed?
Why am I on this wall?
Where's Buttercup?

In the past, we've done some neat work with soil logistics once it's been removed, but what about planning while it's in the ground?  Sure, we have soil pre-characterization reports, but they tend to look like a civil engineer and Charles Dickens teamed up to write War and Peace II.

In a perfect world, we'd get a 3 dimensional model from the civil engineer in charge of the soil report.  Since we're a few years (or decades) away from that, the next best info we have is the excel chart of soils at depths.

With some creativity (and a little brain damage), we can make something visually intelligent out of a mess of a spreadsheet.


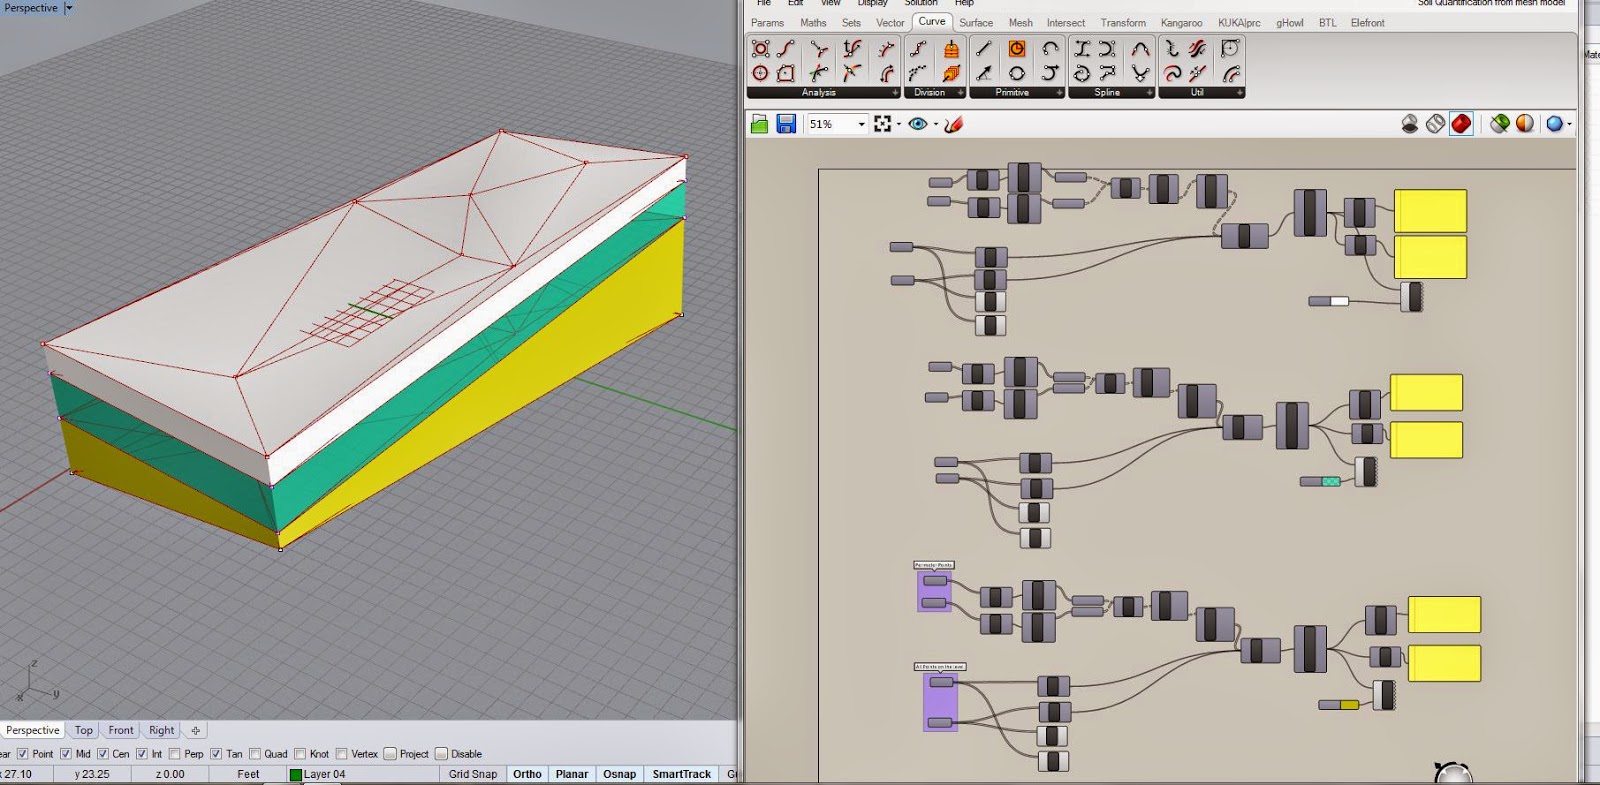
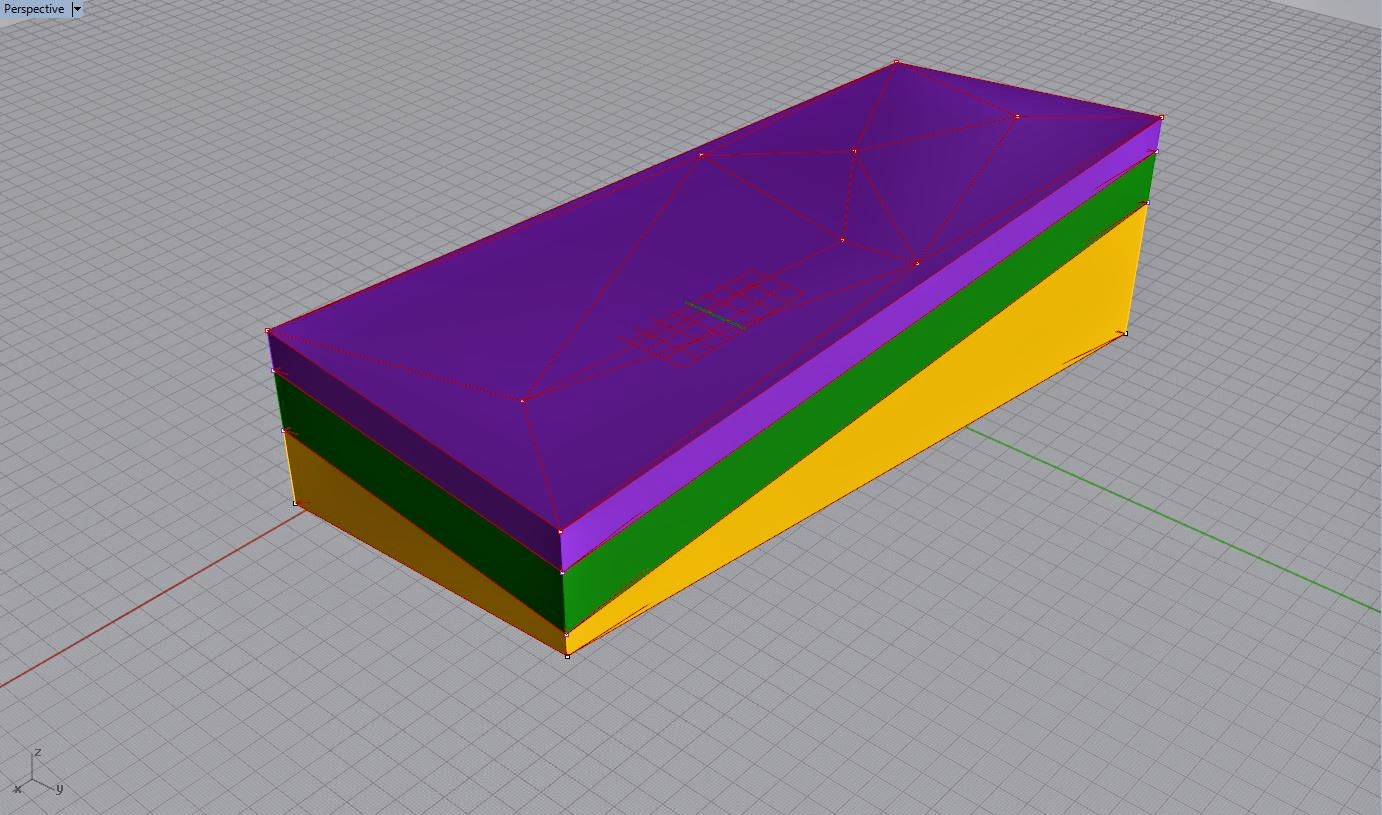
Step 1:  Determine what data is available to you.  Ideally, you'd get the actual soil core drill data.  With that info, you know the top and bottom dimension to each strata layer from a surface dimension.

Step 2:  Re-build the core, digitally.  We do this because we're going to have a mesh, and meshes are informed by points.  Cores are roughly circular, have a center point that is easy to locate on global x,y,z, and are easy for rhino/grasshopper to play with.


Step 3:  Use some grasshopper magic to create the meshes of each strata.  Yes, there is some error in the final mesh, but it is as accurate as the cores are.  That is, the more core samples you take, the more accurate the 3D model will be.


Step 4:  Section cut for clarity.


Step 5:  Export in STL format for 3D printing.


Voila!

Sunday, January 12, 2014

The Better Building Bureau is headed to Stuttgart!

As part of an exciting new opportunity with Gilbane, I will be headed to Stuttgart to work with Zublin's 5D/VDC Group.

It's been an awesome 1.5 years in Boston, and I'm excited to be headed to a new opportunity.

I'll be in Stuttgart for 3-5 months, and will continue to post photos and words of wisdom from our German cousins.

I should be back in Boston in early May.


Auf Wiedersehn Amerika!

Monday, December 2, 2013

NENG_VDC Update: Laser Scanning Train the Trainer

This week, the folks in WRO were kind enough to lend us Kyle Szostek from the Phoenix office for some laser scanning training.  


We spent Tuesday scanning slab edges at our super-secret site in Boston to prep for glazing adjustments, and Wednesday scanning the interior of a fit-out job in Southie so the owner and tenant have extremely accurate as-builts of in-wall utilities.  We additionally were able to scan the chiller room of our super-secret facility before we placed the slab, allowing us to mitigate future mistakes if the owner or tenant elects to add additional equipment and corresponding drains.


Over 2 days, we provided initial training of 15 VDC and PE staff on the Boston site in the FARO hardware.  The intent is to provide additional days of iterative training across multiple Gilbane fit-out and new construction jobs.


***Update***


Our FARO Focus 3Ds arrived today. 


Feelings are strong in the office....


....at first we were like this.....


.....and now we feel like this.....


Sunday, September 8, 2013

Lean Construction's Inherent Failure: Too much data for an analogue process.

In Re-fabricating Architecture, Stephen Kieran and James Timberlake talk about pre-fabrication and contrast the AEC industry with the OEM industry.  What they don't provide is a solution for reconciling initial cost with total cost.  When the schedule is compressed, and money is not available to accelerate it, how does the CM deliver the building on time and at budget while maintaining its standards for quality and safety?  

Any solution requires additional CM/TC input at the design table.  As a tenant comes on board and wants to change the design, the CM in the past has accepted the change at its face-value.  The change is often documented in plan, and if the CM is lucky, in section.  
 
Prior to a model-based workflow, it was nearly impossible to account for every upstream and downstream impact to the design change.  The resultant vector usually ended with inflated estimates, rework, and additional costs through completion to accommodate the downstream trade contractors.  The CM, in turn, becomes the villain for not perfectly anticipating every impact.
 
However, the use of the model-based workflow, design model coordination, and TC involvement with the architect during design development allows the CM to provide the designers and the owner/tenant with very near real-time estimates.  These estimates very well could come in higher than estimates in the previous process, but they also more completely capture the total scope of the change.  The question then becomes:  Is it more preferable to rip the band-aid off in one motion, or pull at it one millimeter a day for 8 months?  


2D documentation of a typical change to add additional beams below an elevator:
 
-No depth to documentation
-No coordination with architect with regard to building code
-Omni-directional information flow - limits ability to 'read and respond' to change
-Finally.....Makes the eyes bleed.


3D documentation of the same change by CM
 
-After fire-spray and soffit to protect elevator equipment, room does not meet building code for head height clearance
 

What we've seen to-date is that the decision makers get sticker shock because they're working from a poor baseline of experience and documentation.  Very rarely is the entire change-order log digitally re-integrated with the initial estimate to determine the full cost of a job.  What should be a closed feedback loop is inherently incapable of metastasizing during a full project life-cycle (there is just too much information to process in analogue).  This, in effect, poisons the next job, because the project teams accept an incomplete and inefficient process as a success, as long as the building is finished.

So what is the solution?  

Firstly, there is simply too much information to handled by humans, notepads, and 36x48s.  Project teams need databases, not drawings.  Decisions should be made with the maximum information at hand.  

Secondly, design teams need to get away from the 'ambiguity through obscurity' of 2D documentation.  If the A/E team refuses to document scope in 3D, the CM is going to do it anyway, and use that authoring power to drive the design in its interest.  


--Myers

Wednesday, June 5, 2013

As-Builts: From Spreadsheets to Intelligent Deliverables


Often enough we receive surveys or as-builts that look like this:


.....when our design models have a higher level of detail.


Our message to all parties is that points in x,y,z coordinate space are ultimately the most useful deliverable the field can provide VDC.  With points, VDC can then provide almost any deliverable to the field with the same accuracy as the laser measurement.


With elements verfied by laser, VDC limits the company's exposure with the early knowledge of dimensional variances. 


We then re-insert these variances into the Revit model and update our structural fabrication steel process (still in the detailing phase) with accurate as-built information.....in under 24 hours.


This process keeps the work in the field moving, allowing Gilbane to maintain the aggressive schedule.


--Myers

Monday, May 6, 2013

BIMForum and the Generation Gap

Gilbane VDC recently attended the BIMForum in Miami, FL; where the theme was "The Human Side of BIM."


To avoid the "Death by Power-Point" syndrome typically occurring at these conferences, the presenters used the Pecha Kucha format, where they only have 20 seconds to address the current slide.  

Because the presentations were so short, it eliminated most of the 'fluff' that typically occurs, making the presentation all meat and no filler. 

During the course of the conference, several presenters tried to infer that there was not only a communication gap between members of the A/E community, but that communication gap could be filtered and ordered by age group.  

As presenters came and went, it became fairly obvious that most of the presenters were of the 'baby-boom' or 'generation-x' age groups; yet they were all speaking to the difficulties in managing the 'millennials', or people under age 30.

As us millennials sat in the crowd, continually being told that the A/E business doesn't, and will not support our desire for a fluid, collaborative, and ever changing set of workflows, I couldn't help but wonder if VDC, as it is used today (not truly integrated in design, development, or execution as one process) is just reinforcing the stigma that employment of 20 somethings is a necessary evil: to be used and abused until they've been broken by the system.  

Only once the fight to change the industry has left us, can millennials be assimilated into the 'design --> rfi --> communication failure dysfunction' culture of the A/E industry. 


      Resistance is futile


The reason for the above thought was highlighted later in the presentations: people in general have a physiological aversion to change.  Change elicits a 'fight or flight' emotion in almost everyone.  Because of this, persons who have been inside the industry for 15, 20, or even 30 years cannot understand how a sudden, cataclysmic event, such as converting a drawing-based process to a comprehensive model-based process could be a good thing for all parties.  

In some ways, they are right.  VDC is a disruptive process.  It tries to overcome (mostly) custom details and shoddy craftsmanship with difficult to use technologies and workflows.  Can you imagine if Mercedes treated their manufacturing process like the A/E industry treats it's products?  (We will address the custom fabrication of custom building components at a later date.)

Going back to disruption, it is my opinion that the adaptation of a model-based workflow which is run by young, eager, innovative architects and engineers could be compared to a tidal wave headed for shore. It is better to latch on early, (even if you fall off your board from time to time) ride the crest, and have a smooth landing than to stand in the way of the wave, fist shaking at the whippersnappers while the wave smacks you in the mouth.

Monday, February 25, 2013

Level of Detail and the Risk vs R.O.I: How much should we model in support of the construction effort?

It's one of the hardest thing to quantify in the industry: at what point does the A/E team's responsibility to design a workable solution end, and the TC's logistical design of construction means and methods begin?  Additionally, what risk is left in the gap where that split occurred?

Often, the gap is made up in sketches by the A/E team.  Sketches are about as useful as the napkin they're drawn on: okay to clean up a bloody mess, but not really efficient at preventing the initial nail through the foot.

Most T.C.s we've encountered are hesitant to model from the conceptual phase in parallel with the designers, as they see the means and methods, design, and logistics as an extension of the direction of the A/E team, rather than an iterative process that they can shape to both their fiscal benefit and the overall quality of the project process.

This gap of modeling responsibility leads to an issue in scheduling on IPD projects with compressed time-fames, especially when a design consultant refuses to model schedule-sensitive elements in 3D.

Ultimately, the responsibility falls on the CM to ensure the proper coordination of elements installed to the design-intent of the A/E team.  Because of this, CMs cannot stand by and plead ignorance of designed elements when there are potential spatial, sequencing or schedule risks.  Buildings have become so complicated, and owners so tight-fisted with the state of the economy, that processes not utilizing a complete, integrated VDC effort will suffer fee-erosion due to factors outside their control.

For example:

On a life-sciences building in New England, Gilbane is faced with a site that requires extremely accurate placement of underground plumbing elements.  Because we know the placement and sequencing of sub-surface precast structures is of the utmost importance to keep our tight schedule, we actually modeled the zone-of-influence below the structural footings (based on a typical structural criteria) to avoid subsurface undermining.


Now, I have no business designing footings. We have a wonderful structural design team sitting in colocation with us who does that.  What is my business is the successful execution of the coordination effort of all ME&P in the building.  Because of that, I needed to be able to tell my plumbing designer how close to the footings he could place his precast structures before we were in the "danger zone."

This type of modeling could be considered by some to be 'risky', in that we are providing (a sort of) dimensional data to a subcontractor who is contractually obligated to a set of 2D drawings and a spec.  But what ended up happening was that our structural engineer saw the value of the coordination effort, and she incorporated the zone-of-influence family into her design model, which then goes on to produce later documentation.

So, in the TLDR version, Gilbane was able to coordinate a tight underslab ME&P situation to an accuracy of under an inch using total-station layout and drive a model-based process in a situation where the sub-surface engineer refused to model in 3D. 


Sunday, December 23, 2012

Crane Path Optimization (without using Calculus.....yay!)

I know you've often wondered to yourself, "what's the best crane placement where I can make the most picks, while not having to move the cranes at all?"

OK, so maybe it is just me, but since we're there, we may as well take a look.  

We could do several optimization equations (ick) with minimum and maximum crane pick radii to minimize the overlap and maximize the total area covered.  That sounds really hard, and quite frankly, about as much fun as driving the Reliant Robin on the Circuit de Monaco.


Or, we could use Rhino and Grasshopper to (mostly) automate it. 


Open up Rhino, and set three points on the x-y plane.  Let one point act as an intersection between the two crane paths, and the other two act as base-points for the crane placement.  Open up grasshopper, and place three separate point parameters.  Assign each parameter to a point.  Then, use grasshopper to assign a vertical line at each point that extends to the height of your cranes.  


Now, all you have to do is apply a surface free-form revolution  battery to the lines, using the middle intersection point as the "profile curve" for each revolution.  


With shaders and some nifty algebra, you can determine the radii of each crane, and match them to your crane cutsheets that your superintendent gave you.  


There are a couple ways to do this, including using multiple intersection points and testing whether certain points fall within the paths, but we do have to keep some some secret sauce items to ourselves.  


Good luck and happy holidays   

--Myers


Thursday, December 20, 2012

Hollywood with a shot of Reality


Let's start with the obvious.  If a picture says a thousand words, what does an interactive model of building systems tell us? 

If you're unfamiliar with the term Hollywood BIM, see here, and here.  John Tocci and Laura Handler explain the concept very well.  

My goal is blend good, database informed BIM with aesthetically pleasing, well detailed additives that inform the viewer, and align their thought processes with ours.  


What you see above is a basic deliverable to our estimating team.  The graphic is straight out of Revit, as is the information.  

With the image on the same page as the QTO, it gives a degree of believably to the data.  With a common server setup, links inside excel can direct our estimators directly to the Navis .NWD for their own reference.  With Navis search-sets able to provide real-time QTO, our estimators can justify their quantities to themselves, the project leadership, and the client.

John Tocci talks about the model being the ultimate conflict resolution tool.  So far, we've been able to preempt several issues with a new curtain-wall system, and drive the total material costs down to a justifiable number.  


We do the same thing with all the glass on the building.  In addition to accurate material and wage QTOs, we were able to give project leadership a total square footage of all glass in the building for the window washing budget.  


---Myers

Boston, MA


From the (previously occupied) desk of Gilbane's WRO_VDC:

We've been out of blogging commission for a while, and with good reason.  John Myers has re-located to Boston to coordinate the VDC engineering on a major Gilbane life-sciences project.  John Tocci is running the overall integration effort here, in an attempt to bring some West-Coast BIM to the East Coast.  

This blog is going to highlight the effort on the Boston job, as well as documenting a new approach to construction management with VDC deliverables as the communication media.  

With that being said, my name is John Myers, and welcome to the new site for Gilbane's New England VDC Region. (NENG_VDC)